
Brief Introduction
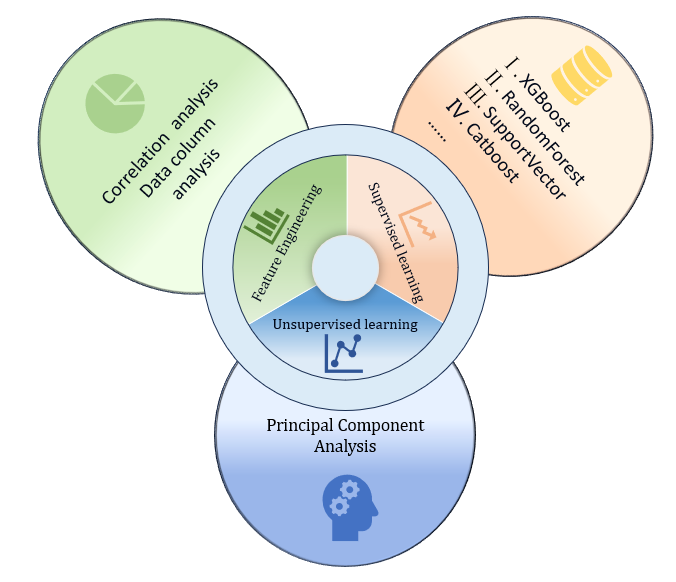
ML-Informatics Overview ML-Informatics is a tool that integrates various machine learning methods to simplify data analysis and modeling processes. It encompasses three main modules: Supervised Learning, which includes classic algorithms like XGBoost, Random Forest, and Support Vector Machines for classification and regression tasks; Feature Engineering, which offers functionalities such as correlation analysis, correlation matrix diagrams, and data column analysis to help users understand and select effective features; and Unsupervised Learning, featuring Principal Component Analysis (PCA) for dimensionality reduction and simplifying complex datasets. ML-Informatics provides users with a comprehensive suite of machine learning tools, making the workflow from data preprocessing to model building more efficient.
Dataset
The "Dataset" module provides a straightforward interface to help users upload and prepare data for analysis. Users can upload a CSV file, preview the first five rows of their dataset, and select specific variables for analysis, such as `NAME`, `STRUCT`, or `Formation_energy`. It also allows users to define a target column (e.g., `Formation_energy`) for predictive modeling, choose an element column containing chemical formulas or other key information (e.g., `NAME`), and specify the column that contains structure paths (e.g., `STRUCT`). This module simplifies the data preparation process by providing user-friendly tools to effectively manage different components of the dataset.
Descriptor
TThe "Descriptor Selection" module allows users to choose descriptors for material property prediction, divided into three categories: Matminer Descriptors, which include elemental and chemical property descriptors like the Miedema Model and Oxidation States; Structure Matminer Descriptors, focusing on structural features such as Density Features and Bond Fractions; and DScribe Descriptors, which provide advanced descriptors like Coulomb Matrix, SOAP, and MBTR. This selection helps users effectively customize features for their specific analysis, improving the accuracy of predictive models.
Settings
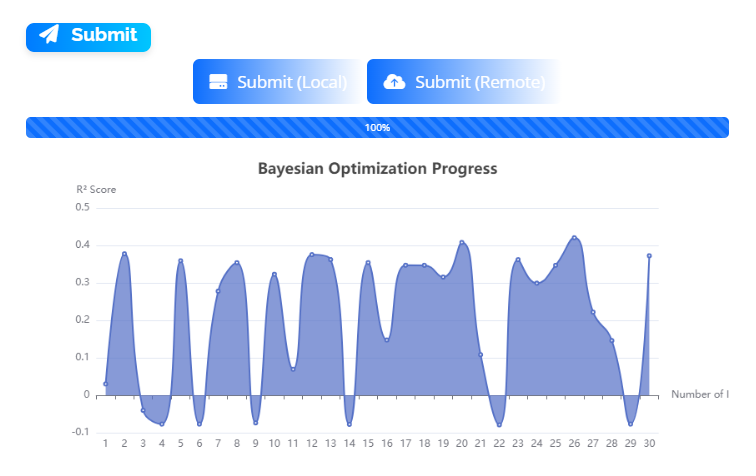
The "Settings" module allows users to set model parameters in the frontend, which are then optimized using Bayesian optimization. Users can configure the following parameters: Test Size, which defines the proportion of data used for testing; Cross-validation Folds, used to assess the robustness of the model; and Importance Value Threshold, for selecting features that contribute significantly to the model. These settings help in efficiently tuning hyperparameters to improve the predictive performance of the model.
Results
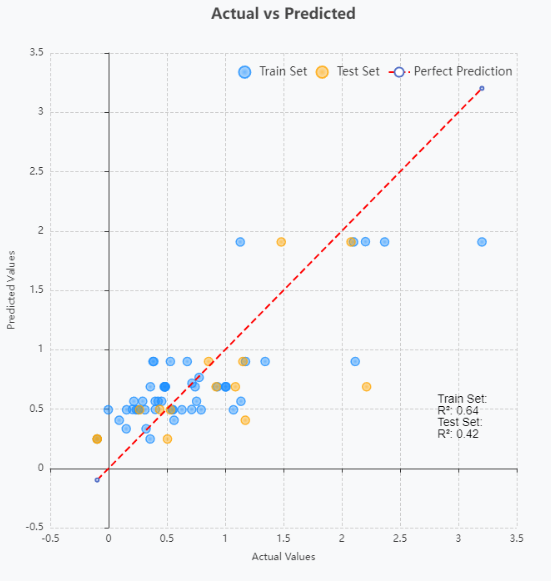
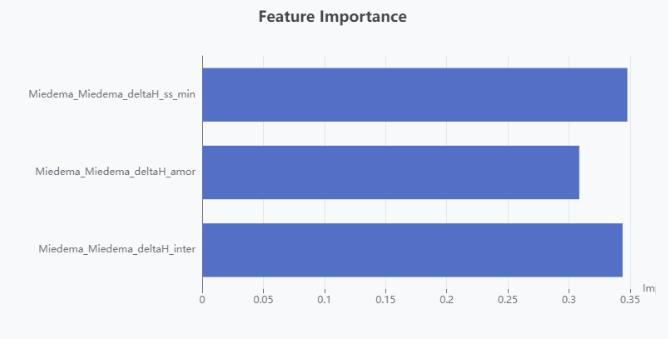
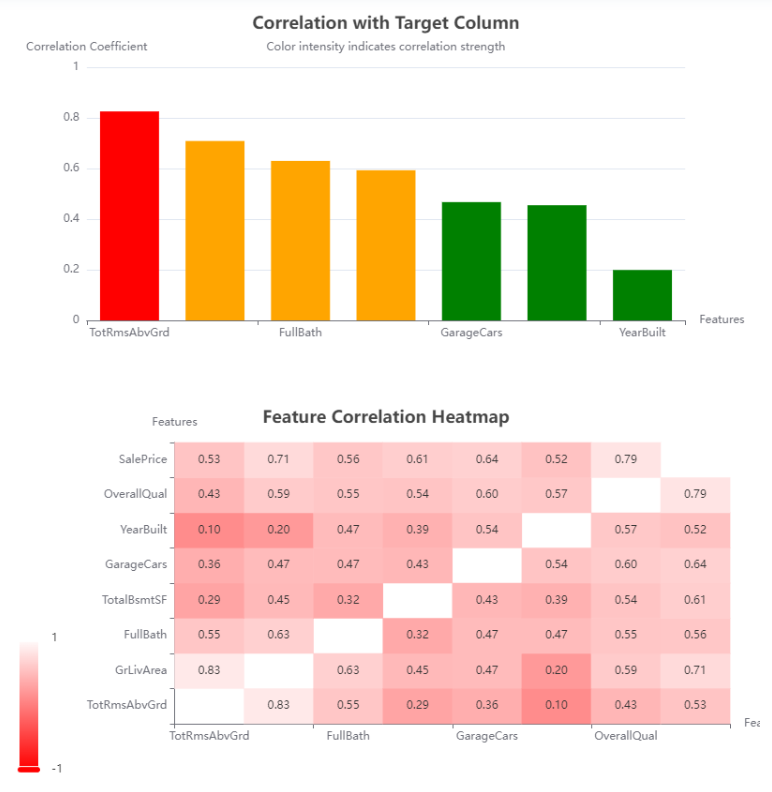
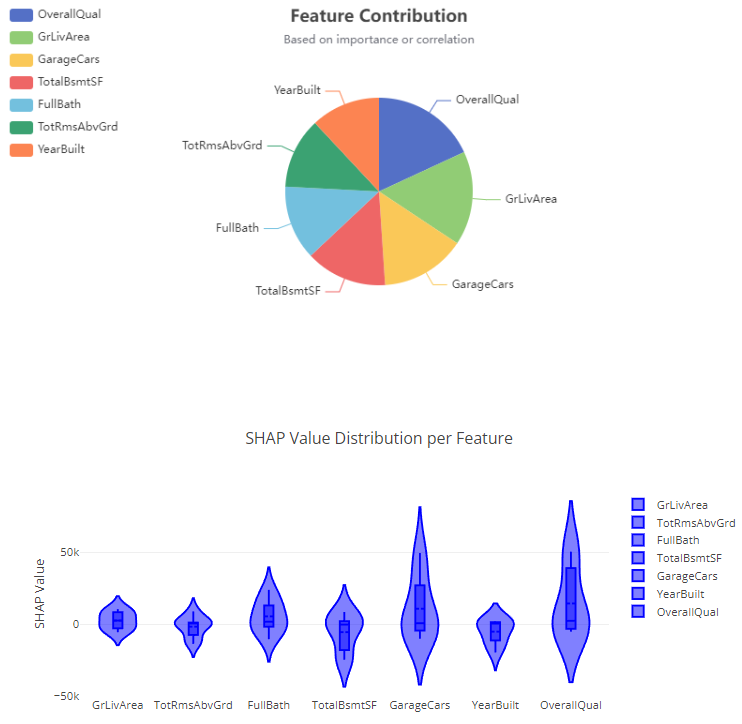
The "Results" module displays the final results after hyperparameter optimization, including the list of optimized hyperparameters such as n_estimators, learning_rate, and max_depth, which improve model performance. The p-value provides information about the statistical significance of the model. Users can download the processed dataset as a CSV file and explore various visualizations, including Prediction Results, Residual Plot, Actual vs Predicted Plot, and Feature Importance Plot. These visualizations help evaluate model performance and provide insights into model behavior.
Feature
- Dataset Module: Allows users to upload CSV files, preview data, and select variables, target columns, element columns, and structural path columns. This helps in effectively managing and preparing datasets for analysis.
- Descriptor Selection Module: Enables users to select different descriptors for material property prediction, including Matminer Descriptors, Structure Matminer Descriptors, and DScribe Descriptors. These features allow users to tailor the analysis by selecting descriptors that best match their modeling needs.
- Settings Module: Provides parameter settings for model optimization, such as Test Size, Cross-validation Folds, and Importance Value Threshold. These settings are used for hyperparameter optimization through Bayesian algorithms, improving model performance.
- Results Module: Displays the final optimized hyperparameters, p-value for model significance, and provides a download option for the processed dataset. It also offers visualizations like Prediction Results, Residual Plots, Actual vs Predicted Plots, and Feature Importance Plots to help users evaluate the model's performance and interpret its output.
Gallery